Pipeline Analytics
Understand Pipeline analytics
Pipeline analytics helps you understand volume, progress, response quality, team activity, outcomes, conversions, and bottlenecks. Open a pipeline and select Analytics.
Your pipeline's friendly name is used throughout the reports. For example, a sales pipeline may display Leads while a support pipeline displays Tickets.
Start with the reporting period and filters
Choose 7 days, 30 days, 90 days, or a custom date range. Calendar days follow your timezone when available, then the account timezone.
You can narrow reports with the filters available for that report, including agent, team, and template. The current-items view also supports a stage filter. Filters are preserved as you switch analytics tabs.
Current state versus period activity
The items tab is a snapshot of what is active now. Analytics reports events or cohorts during the selected period. A person can therefore appear in a report even if their item has since moved, closed, or been archived.
Always check the date range and filters before comparing two totals.
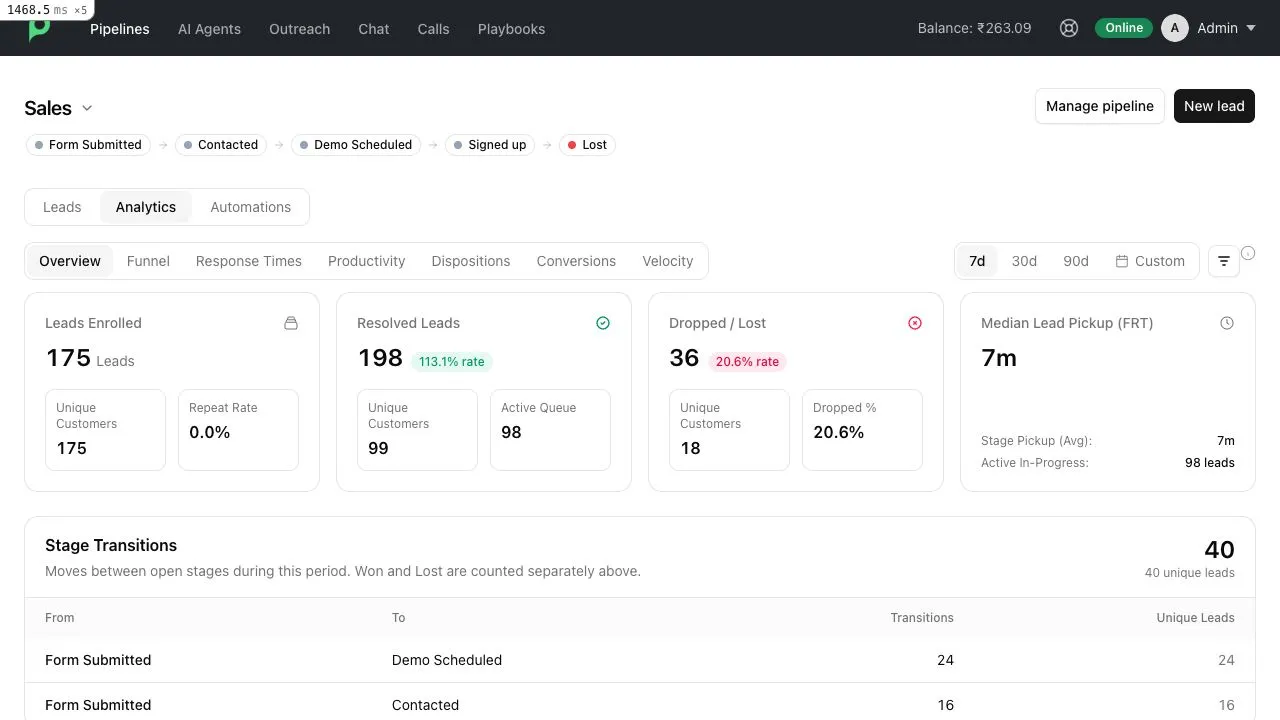
Overview
Overview is the fastest way to understand the pipeline during the selected period.
- Enrolled counts items created in the pipeline during the period.
- Resolved (Won) counts moves into successful final stages during the period.
- Dropped / Lost counts moves into unsuccessful final stages during the period.
- Resolution rate compares successful resolutions with enrollments.
- Drop rate compares unsuccessful resolutions with enrollments.
- Stage transitions lists the actual moves between non-terminal stages, including how many transition events occurred and how many distinct items made each move.
- Active in pipeline is a current snapshot and is not limited to the selected date range.
Resolutions and drop-offs may include items enrolled before the selected period if they reached a final stage during the period. For that reason, resolution and drop rates are operational indicators rather than a strict same-cohort conversion calculation.
Funnel
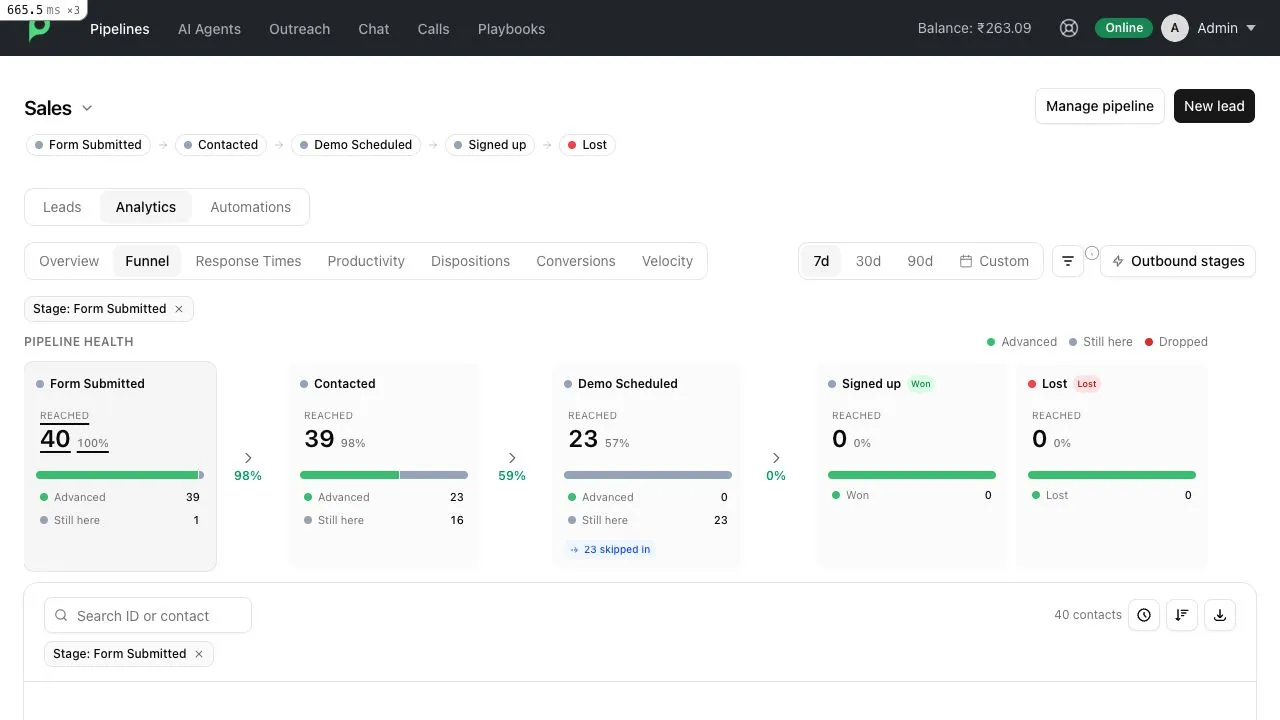
Funnel follows the items enrolled during the selected period and shows how far that enrolled group progressed.
An item counts as reaching a stage when it entered that stage or passed it on the way to a later stage. If an item skips intermediate stages, Peach still counts those stages as reached-or-passed. A stage transition during the period does not pull an older, previously enrolled item into the funnel cohort.
Use Funnel to answer questions such as:
- What percentage of newly enrolled leads reached Demo?
- Where do the largest losses occur?
- How many enrolled tickets made it to Resolution?
If a stage is marked as an outbound stage, its message funnel can also show not contacted, sent, delivered, read, and failed template-message outcomes. Queued messages remain not contacted until WhatsApp reports a delivery lifecycle event.
Response Times
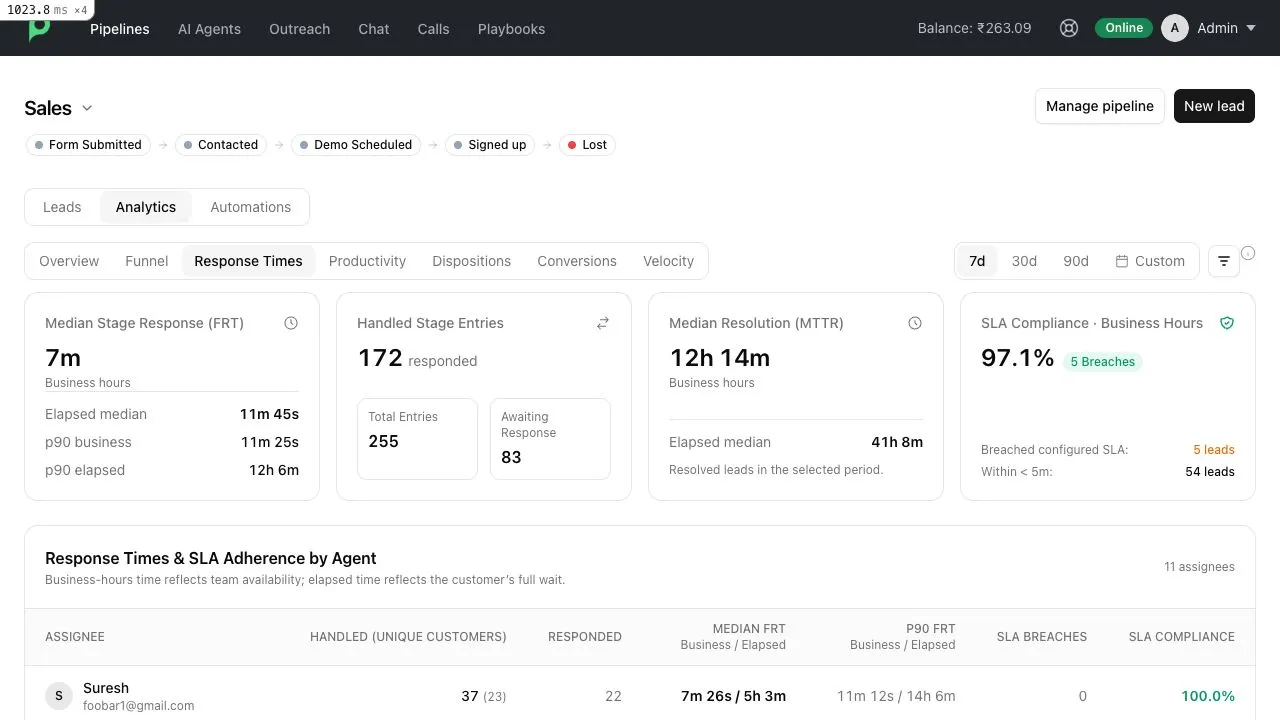
Response Times shows how quickly the team acts after an item enters an open stage, how quickly items are resolved, and whether responses meet the configured targets.
First response time (FRT)
FRT means first response time. It measures from entry into an open stage until the first outbound message sent for that stage entry.
This is stage-based. If the same item enters three open stages and receives a response in each, it creates three handled stage entries.
Median
The median is the middle result after all results are ordered from fastest to slowest. Half were faster and half were slower.
The median is often more useful than an average because one extremely long wait does not distort it as much.
Example: for response times of 2, 3, 4, 5, and 40 minutes, the median is 4 minutes. The 40-minute case still matters, but does not make a typical response look slower than it was.
p90
p90, or the 90th percentile, shows the boundary for the slowest 10% of responses. Ninety percent of measured responses were at or below this time; ten percent took longer.
Example: if p90 FRT is 45 minutes, 9 out of 10 responses took 45 minutes or less, while the slowest 1 out of 10 took longer.
Use the median to understand the typical experience and p90 to find the slow end that averages can hide. A good median with a poor p90 usually means most customers receive quick service but a smaller group waits much longer.
Mean time to resolution (MTTR)
MTTR is commonly read as mean time to resolution. Peach's card is labelled Median Resolution (MTTR) and uses the median so unusual long-running items do not dominate the result. It measures from the item's first-stage entry until it reaches a Won or Lost stage.
Only items resolved in the selected period can contribute a resolution time. A blank value usually means there are no qualifying resolved items or the required historical schedule data is unavailable.
Business hours and elapsed time
Peach shows both views where available:
- Business hours counts time covered by configured availability. It is useful for staffing and operational performance.
- Elapsed time counts every clock hour, including nights, weekends, and other unavailable periods. It reflects the customer's full wait.
Example: a ticket arrives Friday evening and receives a reply Monday morning. Its business FRT may be short if the team was closed over the weekend, while its elapsed FRT includes the whole weekend.
Read both together. Business time tells you how the team performed while available; elapsed time tells you what the customer experienced.
SLA and SLA compliance
SLA means service-level agreement: the response-time target your team has committed to meet.
- Each stage can have its own target.
- If a stage has no override, it uses the pipeline default.
- New pipelines default to 15 minutes.
- Compliance is evaluated using business-hours FRT.
- A breach occurs when a measured first response is slower than the applicable target.
SLA compliance is the percentage of measured responses that met the target. An entry still awaiting its first response is shown separately until it has a response to evaluate.
Productivity
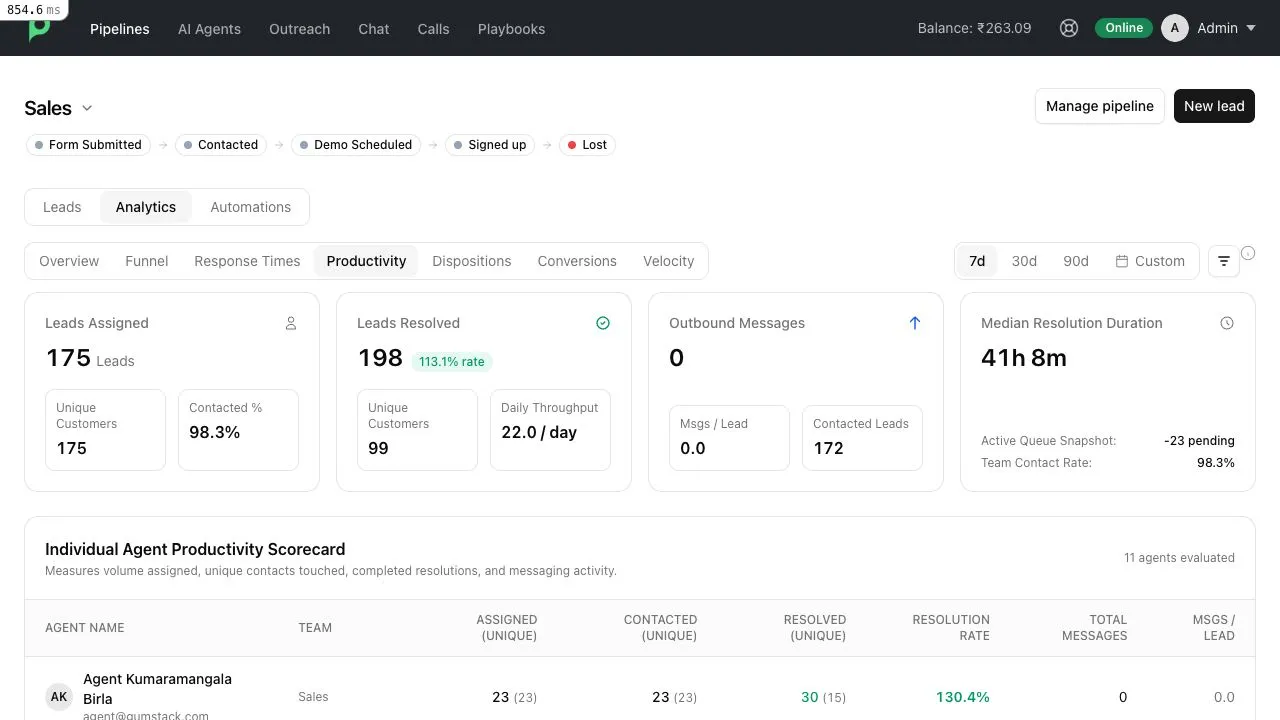
Productivity shows work volume and outcomes for items enrolled during the selected period.
- Assigned shows enrolled items and unique customers associated with agents.
- Contacted % is the share of assigned items with a recorded first response in an open stage.
- Resolved counts entries into Won stages and shows a resolution rate.
- Daily throughput divides resolved items by the number of calendar days in the selected range.
- Outbound messages counts messages sent during the period for conversations connected with the enrolled items.
- Messages per item compares outbound-message volume with assigned items.
- Median resolution duration shows the typical time from first-stage entry to a Won outcome.
The agent scorecard breaks these measures down by agent and team. Values in parentheses are unique-customer counts. One customer can create more than one recorded event, so event and unique-customer totals may differ.
High activity is not automatically high effectiveness. Compare volume with contact rate, resolutions, response times, and SLA performance.
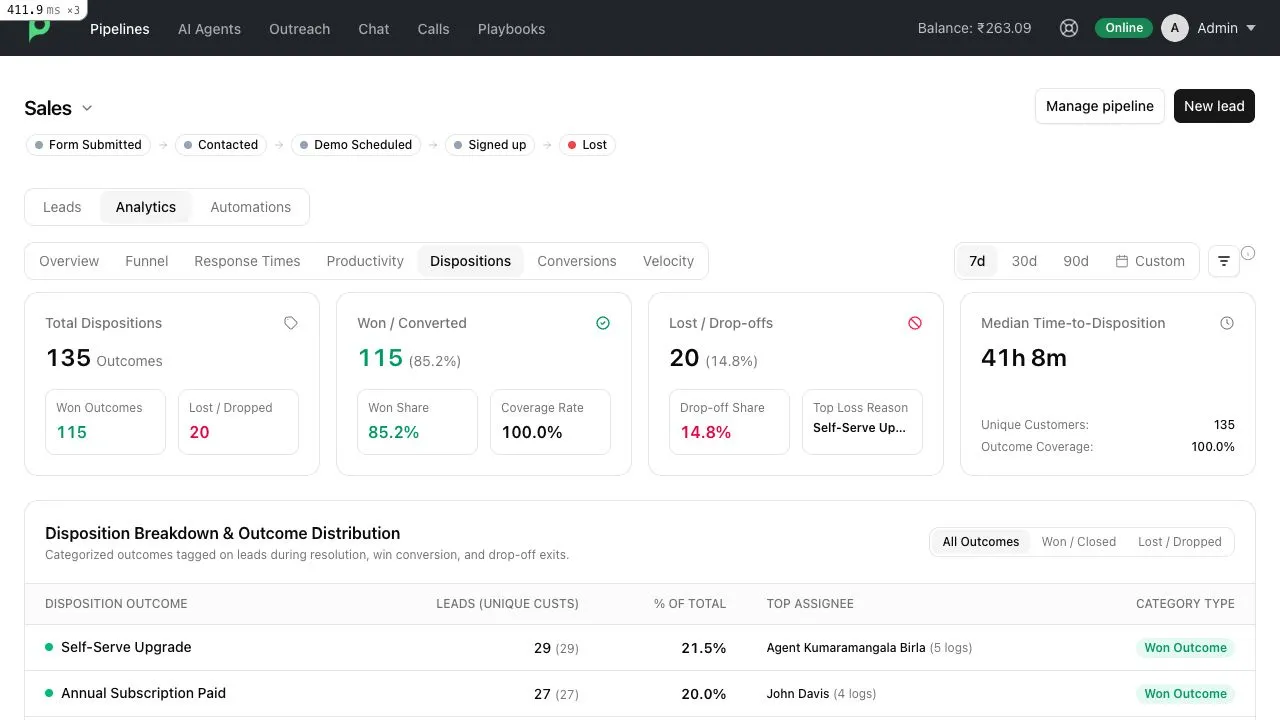
Dispositions
A disposition is the final reason or outcome recorded when work ends. The report groups successful outcomes and drop-off or loss reasons so you can see why items close.
Use it to distinguish, for example, customers who were unqualified from those who were qualified but stopped responding. Consistent reason labels produce more useful reporting.
The summary shows total dispositions, Won outcomes, Lost or dropped-off outcomes, the most common loss reason, and median time to disposition. Use All Outcomes, Won / Closed, and Lost / Dropped to narrow the breakdown.
The breakdown shows each outcome's item count, unique-customer count, share of all outcomes, top assignee, and category type.
Conversions
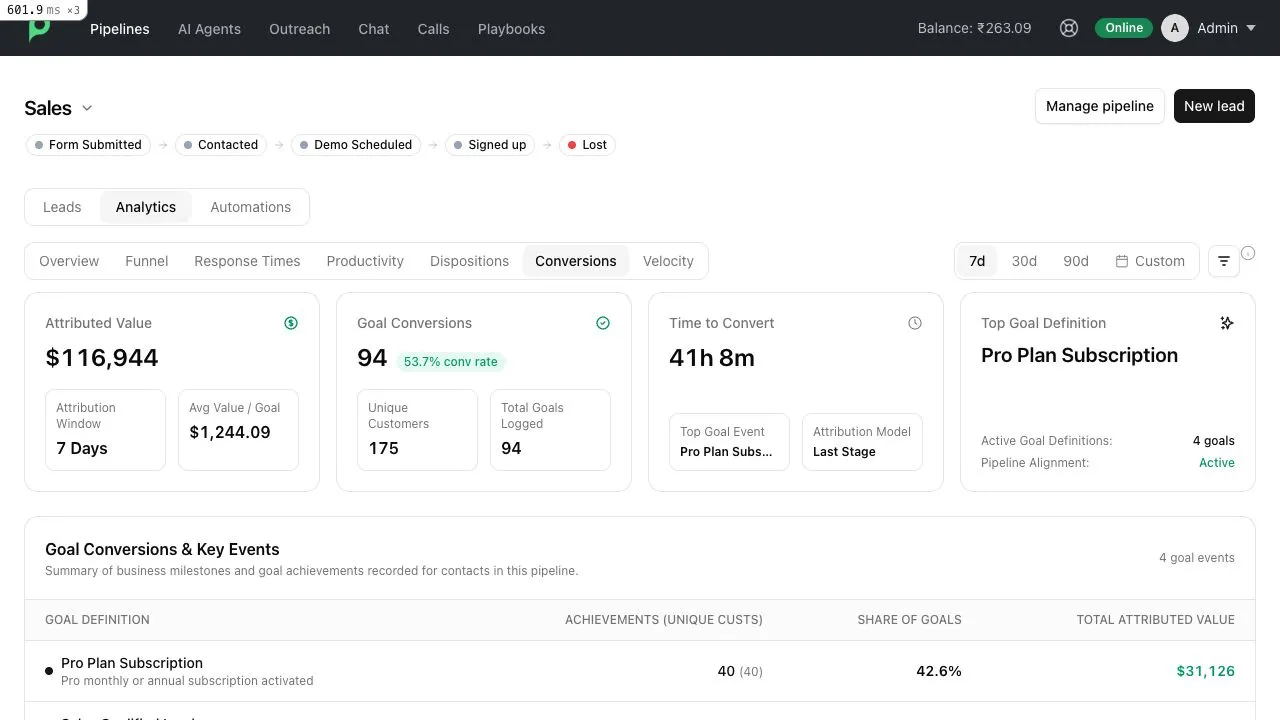
Conversions connects pipeline contacts with recorded business goals, such as an order, booking, payment, or other goal achievement.
- Converted items are pipeline items connected to at least one qualifying goal achievement.
- Conversion rate compares converted items with the applicable handled population.
- Unique customers counts each customer once even if they completed several goals.
- Total goals logged counts every qualifying goal event.
- Time to convert measures from pipeline enrollment to goal achievement.
- Attributed value comes from the value and currency stored with the goal achievement. When the report contains one currency, Peach keeps it. When it contains multiple currencies, Peach converts supported values into the account currency so totals are comparable.
- Last-stage attribution credits the stage or handling context associated with the most recent qualifying pipeline state before conversion.
If Peach cannot convert a goal's currency into the report currency, that goal is excluded from attributed-value totals rather than being added as an incompatible amount.
The goal breakdown shows achievements, unique customers, share of goals, and attributed value for each goal definition. The agent breakdown connects handled items, converted customers, conversion rate, and attributed value with each agent.
Velocity
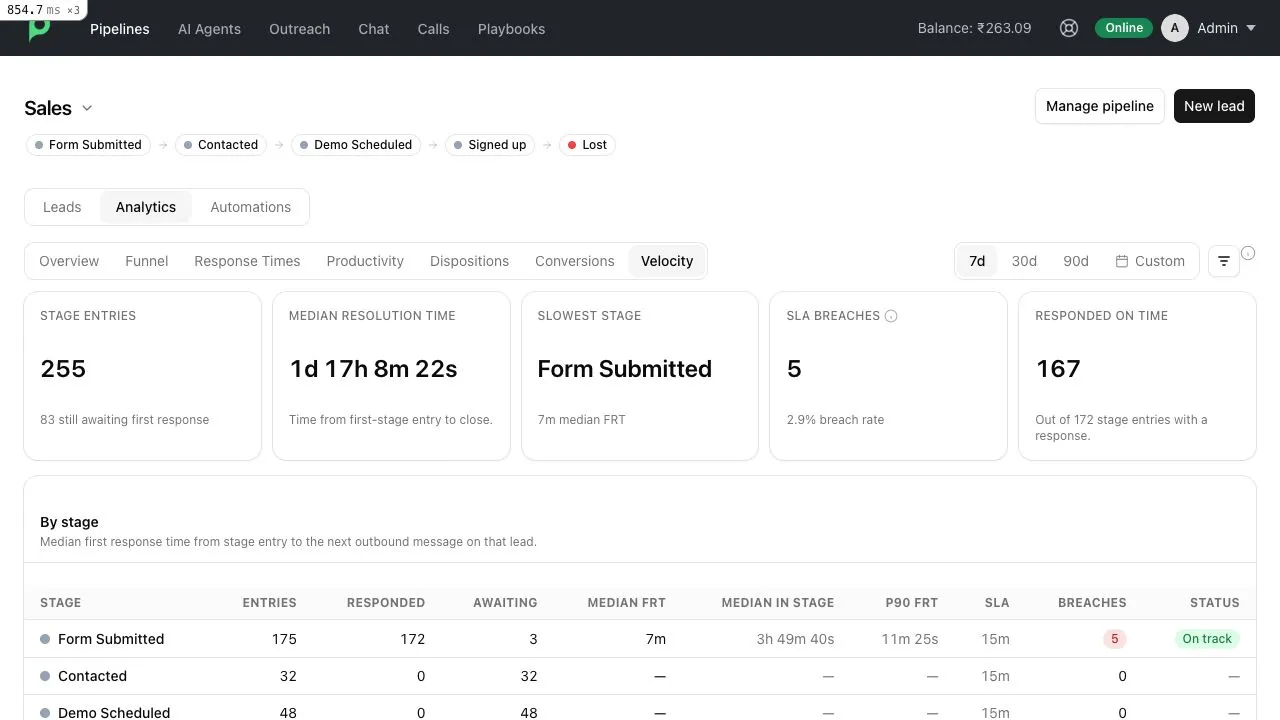
Velocity compares response and movement across stages so you can find where work slows down.
- Stage entries counts entries into open stages during the period and shows how many still await a first response.
- Median resolution time shows the typical elapsed time from first-stage entry to close.
- Slowest stage identifies the stage with the highest median first response time.
- SLA breaches and Responded on time summarize response-target performance.
- Median in stage, also called stage dwell time, is the typical time completed items remained in a stage before leaving it.
The stage table compares entries, responded and awaiting counts, median FRT, median time in stage, p90 FRT, SLA target, breaches, and status for each stage. Won and Lost stages do not accrue a first response time.
A bottleneck is a stage where work accumulates, awaits response, or remains substantially longer than elsewhere.
Use Velocity to improve the process itself. Use Response Times to understand how quickly the team sends the first reply and meets SLAs.
Plain-language glossary
Term | Meaning |
|---|---|
Cohort | A group that shares a starting event, such as all items enrolled during the selected week. |
Conversion | Completion of a meaningful business goal, such as an order or booking. |
Conversion rate | The share of the relevant population that converted. |
Disposition | The recorded reason or final outcome when work closes. |
Dwell time | How long an item stayed in a stage. |
Elapsed time | All clock time, including closed hours. |
FRT | First response time after entering an open stage. |
Median | The middle measured result: half are faster and half are slower. |
MTTR | Resolution time from first-stage entry to a successful or unsuccessful close; Peach reports the median. |
p90 | A time met or beaten by 90% of measured cases; the slowest 10% took longer. |
Reached-or-passed | An item entered the stage or moved beyond it, including by skipping it. |
Resolution | Entry into a Won or Lost final stage. |
SLA | The response-time target configured for the pipeline or stage. |
SLA breach | A measured business-hours response exceeded its target. |
Throughput | The amount of work progressed or completed during a period. |
Unique customer | A customer counted once even if they had multiple events. |
Working or business time | Only time covered by the applicable availability schedule. |